Functional overview
As of today burn-up is based on 'effort' + 'done' status. When team are not using effort (because they are not mature enough to estimate their work or because they are mature enough to go full #NoEstimate) they cannot leverage the benefit of a burn-up chart to get quick sense of iteration progress (are we on track to complete what we have to do or not).
(In addition to / Instead of / In complement of) this effort based burn-up, this story brings an alternative burn-up based on the counting of items.
The rules are the same for the 2 burn-up, the only difference between them is that
- Effort based burn-up takes it values by taking the 'initial_effort' field of the top level element (eg. stories)
- Count based burn-up takes it values by counting the number of elements in the whole cardwall (eg stories + tasks).


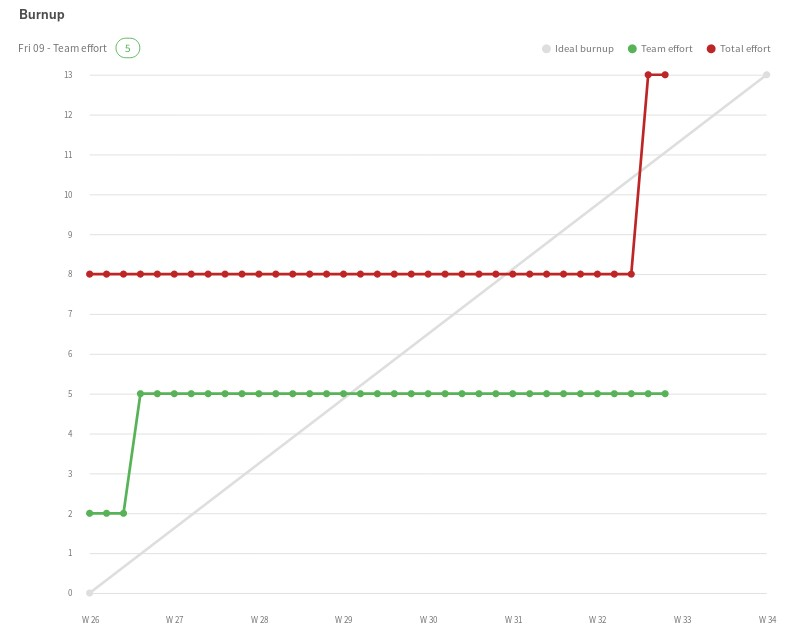
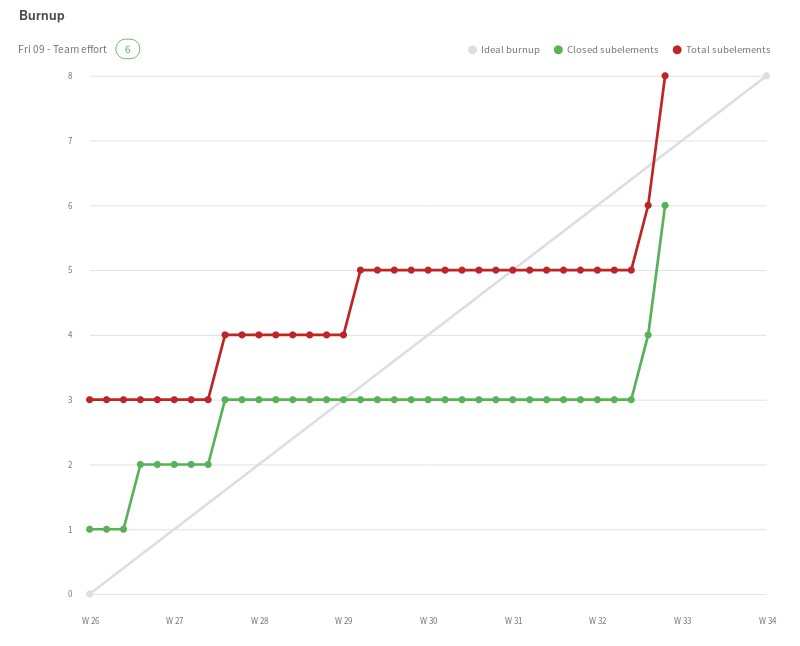
The 2 graphs show the burn-up made on the same artifacts. The first graph displays the effort based burn-up, the second graph the count based burn-up.
On the second graph, you can observe that the 3 lines (ideal, total and closed) are based on the counting of elements. Despite the first graph showing that progress is flat (because no stories get Done) the second one show that works is actually on going because tasks are closed.
The counting is based on all elements:
- A solo story counts for 1
- A story with 2 tasks counts for 3
- An epic with 2 stories and of the story with one of the task with 2 tasks counts for 5. Example: