Tuleap Community Edition development and releases are no longer public. You have until September 30th to download packages and sources in Tuleap project. You can contact the team if you need further assistance.

  •  
     
    story #12540 see status change in a chart over a time period
Summary
Empty
see status change in a chart over a time period
Empty

Given the following data

  • On Sept 2, #123 is created with status "New"
  • On Sept 4, #99 is updated with status "Closed"
  • On Sept 10, #124 is created with status "New"
  • On Sept 11, #124 is updated with status "On going"
  • On Sept 12, #124 is updated with status "Closed"
  • On Sept 23, #78 gets a comment + a remaining effort change
  • On Oct 10, #77 is updated with status "Declined"
  • On Oct 11, #222 is created with status "New"
  • On Oct 12, #223 is created with status "New"
  • On Oct 12, #223 is updated with status "Closed"

The chart renderer over September and October (per month) will be a cummulative bar chart:
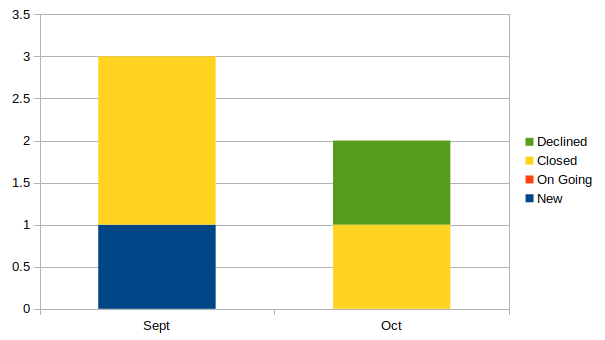
For Sept:

  • New: #123
  • Closed: #99, #124

For Oct:

  • Closed: #223
  • Declined: #77

Comments (questions ?):

  • On Sept, #78 got updated but is not displayed because there is no status change
  • On Oct, #123 is no longer shown as "New" because there were no change

The underlying calculation:

  • For a given period (month), take into account all artifacts with a status change (in previous example, #78 is excluded from counts)
  • Take the last status as the end of time period (the intermediate states are not displayed, as for #124 and #223, calculation is done on Sept 30 and Oct 31 respectively)
Empty
Status
Empty
Ready (stalled)
Development
  • [ ] Does it involves User Interface? 
  • [ ] Are there any mockups?
  • [ ] Are permissions checked?
  • [ ] Does it need Javascript development?
  • [ ] Does it need a forge upgrade bucket?
  • [ ] Does it need to execute things in system events?
  • [ ] Does it impact project creation (templates)?
  • [ ] Is it exploratory?
Empty
Details
#12540
Manuel Vacelet (vaceletm)
2019-09-09 17:52
2018-11-21 10:58
4211

References
Referencing story #12540

Follow-ups

User avatar
A few feelings & suggestions :
- if I had to track "status updates populations", I would use some positive/negative bar chart, i.e. # of INs [during the specified time period] above X-axis, # of OUTs below (ideally with trend dotted lines between successive bars) ;
- here is described more of a "derivative CFD", tracking "status populations update" instead. It may simply be a helper to CFD retrospective analysis.

This matter could be envisioned as a larger Lean/Kanban KPIs Epic (given that Scrum is more featured in Tuleap so far), as would also be of interest :
- artifact status history (cumulative status durations for every artifact of the report)
- status duration distribution (# of artifacts having been in a given status selection for as long as X) => lead & cycle times etc.
- completion estimates for ready or ongoing artifacts with respect to their current column & relative position in the Kanban, to some (maybe hand-saved) array of status mean durations, and optional artfacts' estimated "points" ;
... or merely, in the first place, a pre-digested (somewhat structured) API output specifically designed for status history reporting.

  • Category set to
User avatar
  • Acceptance criteria
    Something went wrong, the follow up content couldn't be loaded
    Only formatting have been changed, you should switch to markup to see the changes
User avatar
  • Acceptance criteria
    Something went wrong, the follow up content couldn't be loaded
    Only formatting have been changed, you should switch to markup to see the changes
User avatar
  • Acceptance criteria
    Something went wrong, the follow up content couldn't be loaded
    Only formatting have been changed, you should switch to markup to see the changes