Given the following data
- On Sept 2, #123 is created with status "New"
- On Sept 4, #99 is updated with status "Closed"
- On Sept 10, #124 is created with status "New"
- On Sept 11, #124 is updated with status "On going"
- On Sept 12, #124 is updated with status "Closed"
- On Sept 23, #78 gets a comment + a remaining effort change
- On Oct 10, #77 is updated with status "Declined"
- On Oct 11, #222 is created with status "New"
- On Oct 12, #223 is created with status "New"
- On Oct 12, #223 is updated with status "Closed"
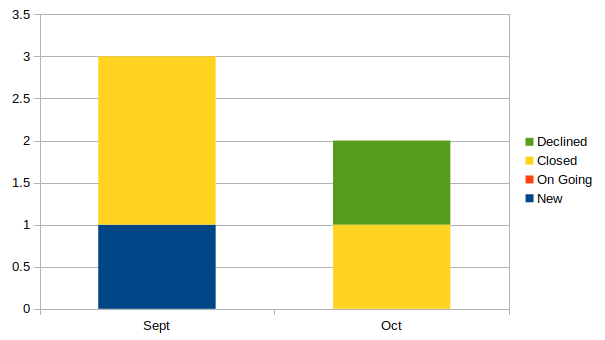
The chart renderer over September and October (per month) will be a cummulative bar chart:

For Sept:
- New: #123
- Closed: #99, #124
For Oct:
- Closed: #223
- Declined: #77
Comments (questions ?):
- On Sept, #78 got updated but is not displayed because there is no status change
- On Oct, #123 is no longer shown as "New" because there were no change
The underlying calculation:
- For a given period (month), take into account all artifacts with a status change (in previous example, #78 is excluded from counts)
- Take the last status as the end of time period (the intermediate states are not displayed, as for #124 and #223, calculation is done on Sept 30 and Oct 31 respectively)