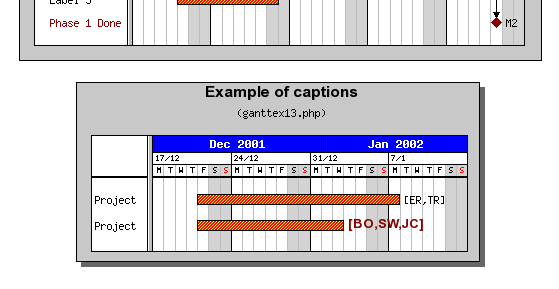
As of today, we use jpgraph to display Gantt charts. However the aesthetic of those charts didn't aged well:

🤢
.
.
.
.
.
.
.
.
.
.
.
.
.
.
.
.
.
.
.
.
(sorry I threw up on my keyboard)
We should provide a modern approach of this chart, with better interactivity, for example:
- show/hide constraints (dependencies)
- show/hide childrens
- dynamic change of scale (no need to edit the properties of the graph)
- update of "tasks" directly in the graph (drag n drop bars to move dates or progress)
- creation of "tasks" directly in the graph