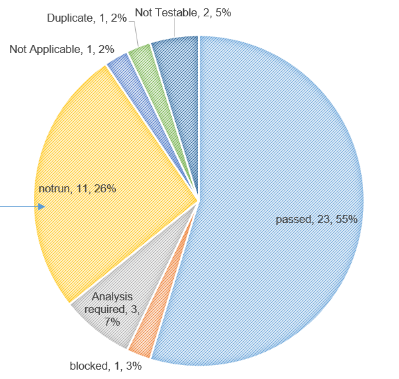
on the Backlog/Test plan view, it will be nice to add the results of the tests as a pie graph.
This graph could not be done at the tracker view as it implies to know the mileston/sprint on going, and the campagins/tests cases/test execution status. So basically it is a cross tracker graph that the user cannot generate himself from the web interface.
The only way to generate it, is to export it and use excel for that.
